Red Hat blog
OpenShift 3.3 was a big release for the web console. There are improvements to existing features, usability overhauls, and a few brand new concepts to try out.
A focus on usability
We are constantly looking for ways to make the existing console features even better. As part of this effort there were two major design updates this release.
Project Overview
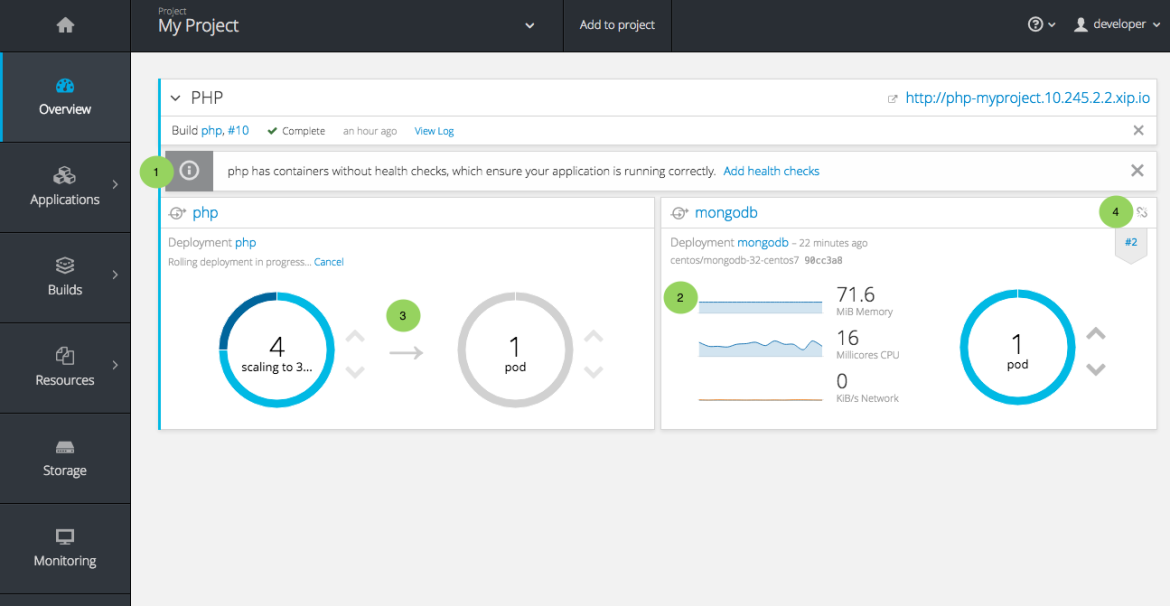
The console’s overview is the landing page for your project. At a glance you should be able to see what is running in your project, how things are related, and what state they are in. To that end, the re-designed overview now includes:
- Warnings, suggestions, and other notifications in context
- Metrics for a deployment or pod
- Better awareness of deployment status
- Animation of rolling deployments
- Cancel in-progress deployments
- Wake up idled deployments
- Grouping of related services
Project Navigation
Prior to 3.3 most of the concepts in OpenShift were hidden underneath a generic Browse menu. We went through an exercise to define our information architecture, and the result of that is the new left sidebar project navigation.
- Overview - the dashboard for your project
- Applications - all of the things that make up your running application. This means pods, things that create or replicate pods, and anything that controls the flow of network traffic to pods.
- Builds - builds, pipelines, and build artifacts like images
- Resources
- resource restrictions like limit ranges, project quotas, and cluster quotas
- other advanced resources in your project that don’t fit into one of the top level concepts
- Storage - view your existing PVCs and request persistent storage
- Monitoring - a single page that gives you access to logs, metrics, and events
New Concepts
Pipelines
With OpenShift 3.3, OpenShift’s CI/CD story continues to evolve. While previously it was possible to define small pipeline-like workflows such as triggering deployments after a new image was built, or building an image when upstream source code changed, OpenShift Pipelines (tech preview) expose a true first class pipeline execution capability. OpenShift Pipelines are based on the Jenkins Pipeline plugin. By integrating Jenkins Pipelines into OpenShift, you can now leverage the full power and flexibility of the Jenkins ecosystem while managing your workflow from within OpenShift.
A new set of pages have been added dedicated to Pipelines that allow you to visualize your pipeline’s stages, edit the configuration, and manually kick off a build. Pipelines paused waiting for manual user intervention will provide a link to the Jenkins pipeline interface.
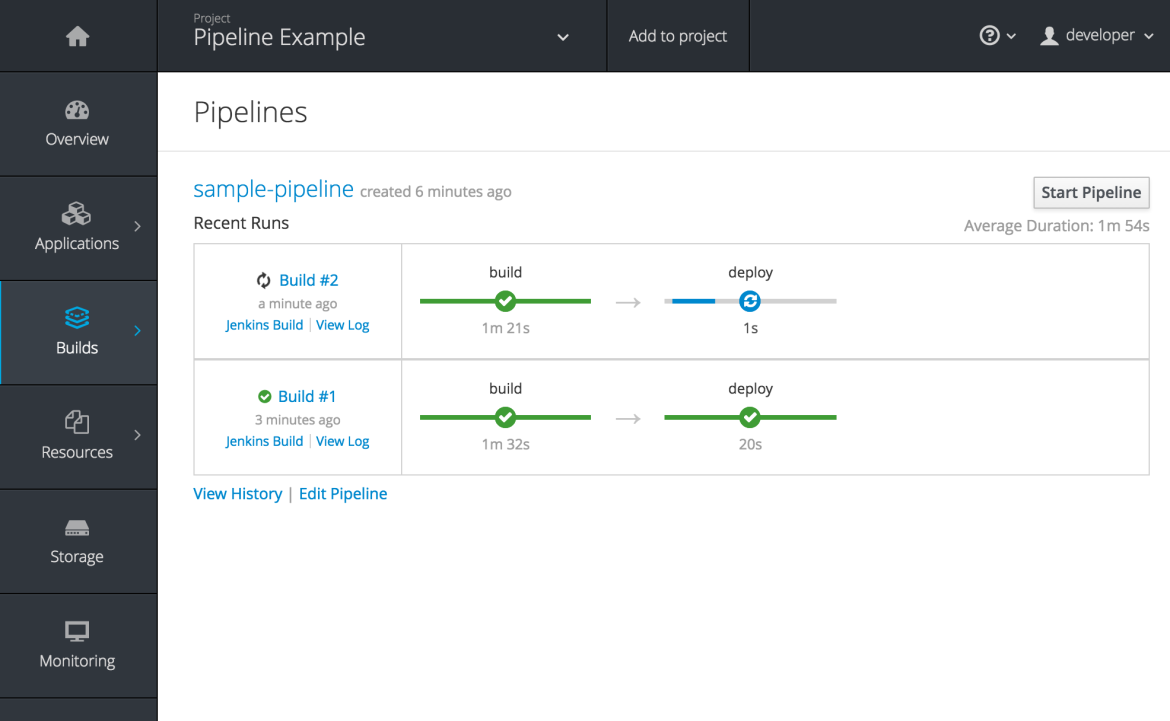
Running or recently completed pipeline builds will also show up on the new overview if they are related to a deployment configuration.
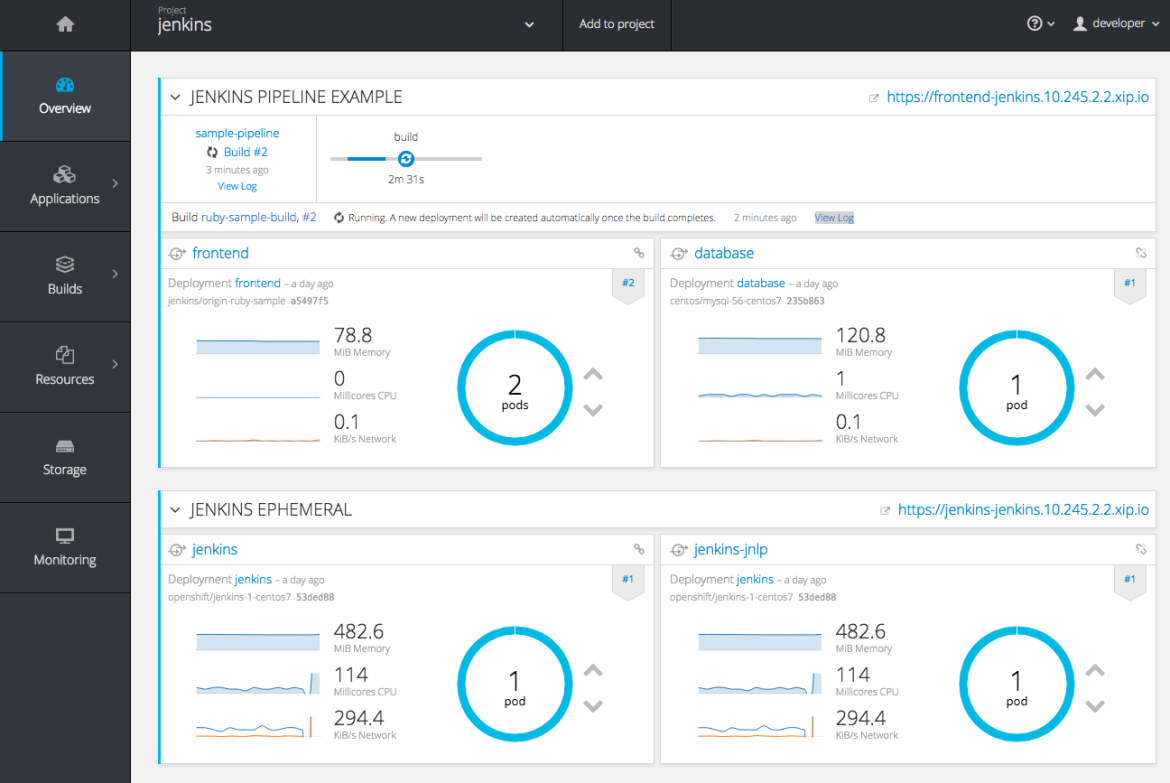
Pipelines are currently in tech preview, to enable pipelines in the primary navigation of the console follow the documentation here.
You can read more about this feature in What's New in OpenShift 3.3 - Developer Experience
A/B Routing
In 3.3 Routes can now point to multiple backend services, commonly called A/B deployments. Routes configured in this way will automatically group the related services and visualize the percentage of traffic configured to go to each one.

Modifying the route’s backend services can be done in the new GUI editor, which also lets you change the route’s target ports, path, and TLS settings.
Using Advanced Features
The CLI already allowed users to tinker with more advanced concepts with commands like
- oc run
- oc create -f
- oc get <any-resource-type>
- oc edit
In 3.3 we’ve added that flexibility to the console.
Deploy Image - ‘oc run’
The ‘Add to Project’ page now has two new options, the first of these is Deploy Image. If you’ve used ‘oc run’ before then this behavior will feel similar. For those that haven’t, it lets you pick any existing image or tag from an image stream, or to look for an image using a docker pull spec. Once you’ve picked an image it will generate the service, deployment configuration, and an image stream if it’s from a pull spec.
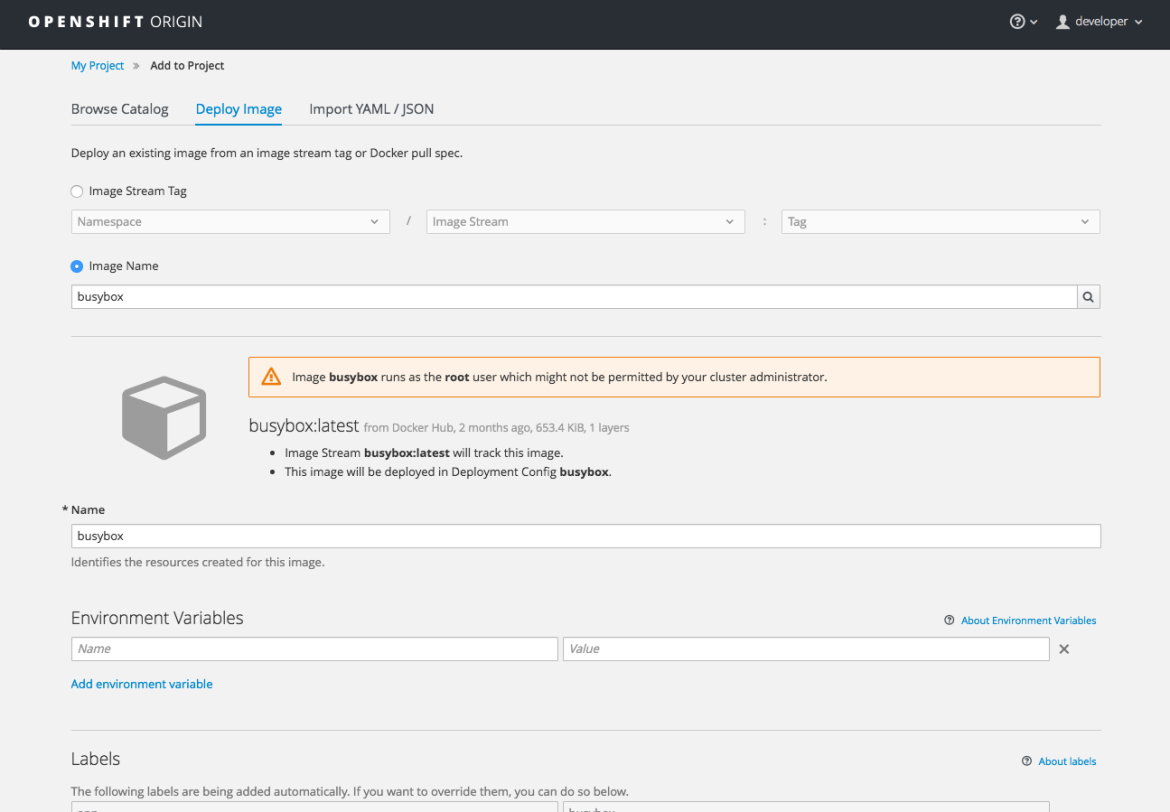
You can also take advantage of the new and improved key value editor for environment variables and labels.
Import YAML / JSON - ‘oc create -f’
The second of the new Add to Project features, the Import YAML/JSON option behaves like ‘oc create -f’. You can paste, upload, or drag and drop your file, and even edit the YAML/JSON before submitting it. If your file contained a Template resource you’ll get to choose whether you want to create the Template resource and / or process it.
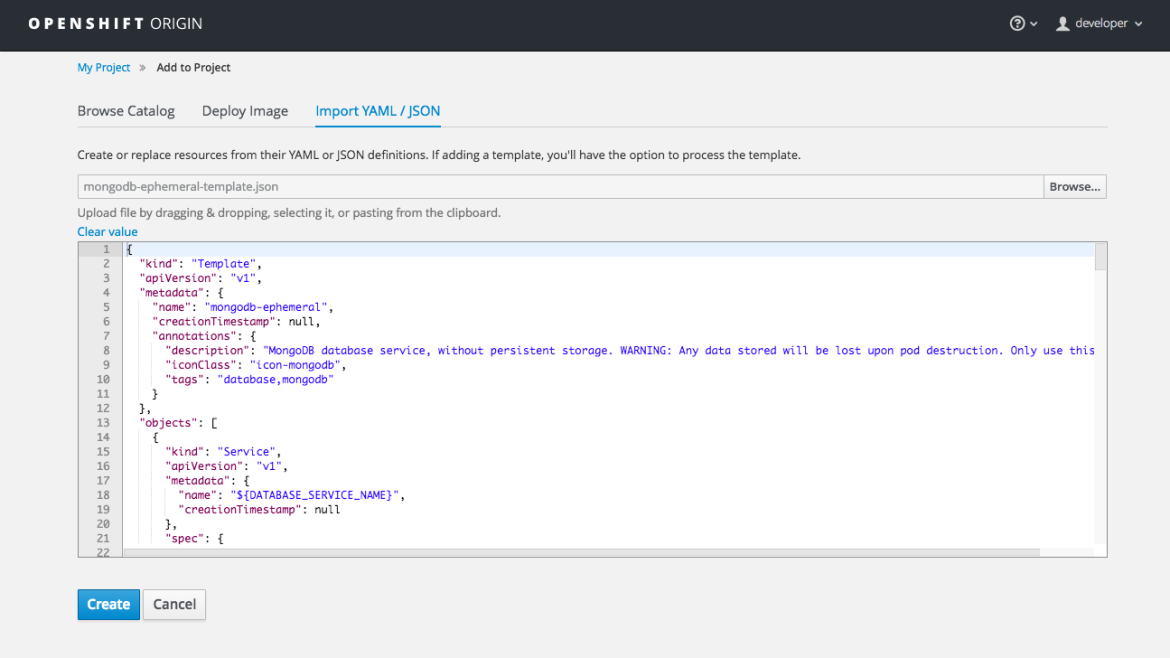
Processing a template goes to the existing experience for creating from a template, and now supports showing a message to the user on the next steps page. This message can be defined by the template author and can include generated parameters like passwords and other keys.
Other Resources - ‘oc get’
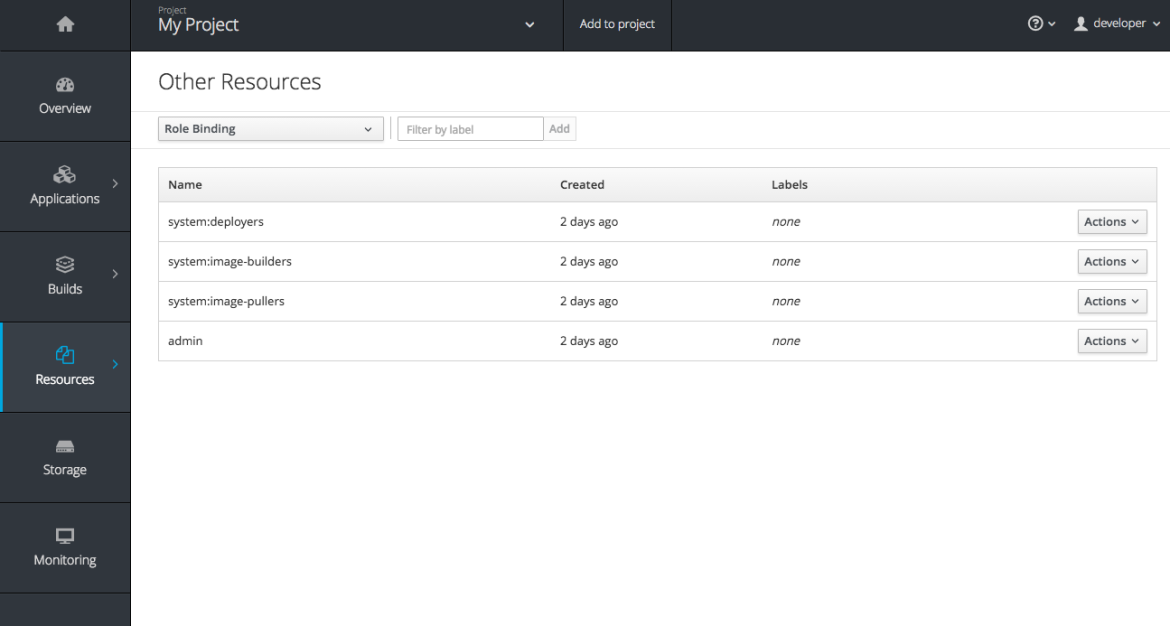
The Other Resources page gives you access to all the other content that exists in your project that we don’t have dedicated pages for yet. You can select the type of resource you want to list, and will get actions to Edit YAML (think ‘oc edit’) and Delete. Thanks to a new feature that has been applied to the whole console, you’ll only see the resource types you have permission to list, and you’ll only get actions that you can actually perform.
Problem Detection and Resolution
Knowing problems are happening and then figuring out why things are broken is an important part of building and running software. In 3.3 we have tried to make that process easier in the console.
Monitoring
While the Overview provides some simple metrics and pod status, the new Monitoring page provides a deeper dive into the logs, metrics, and events happening in your project.
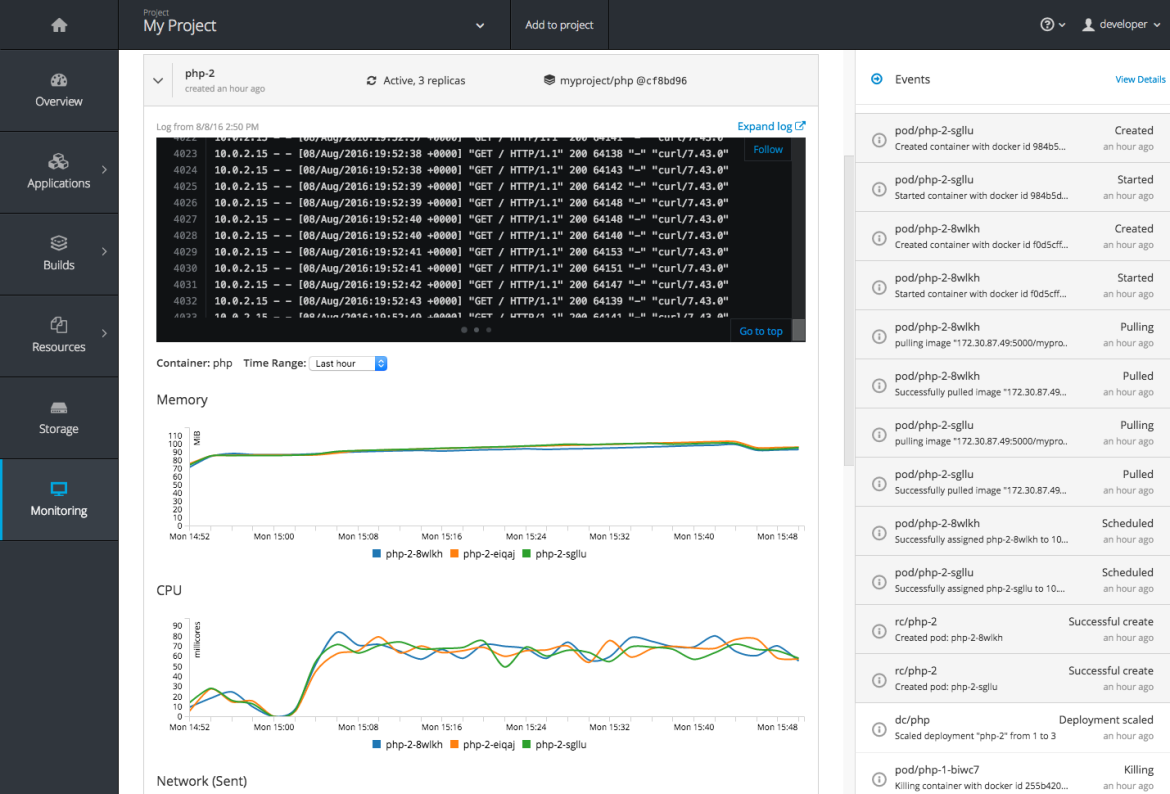
Metrics and logs both received some minor improvements including:
- Network sent and received metrics for deployments and pods
- Deployment metrics show a separate line for each pod
- Log viewer supports ANSI color codes and ANSI carriage returns (treated as new lines)
- Log viewer turns URLs into links
Debugging
When we detect that your pod’s containers are not starting cleanly, you’ll now see a link on the pod details page to debug it in a terminal. This will start a pod with identical settings but will change the container’s entrypoint to /bin/sh instead, giving you access to poke around in the runtime environment of the container.
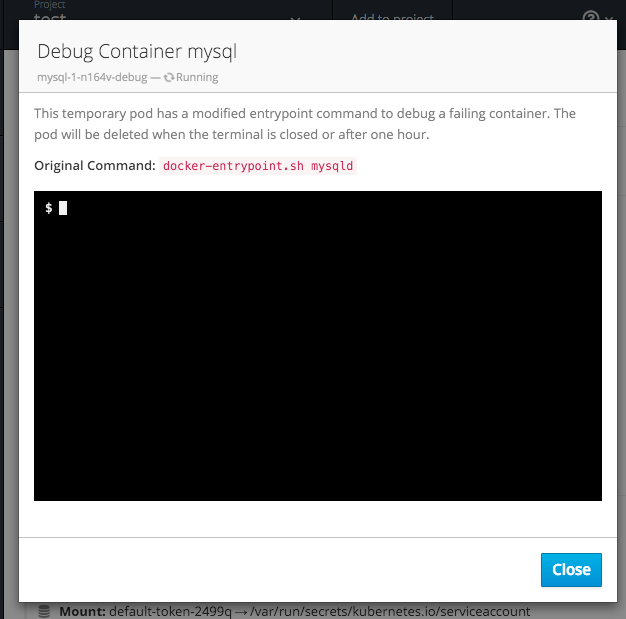
There were a number of small improvements to our container terminal that create a smoother experience, including:
- Auto-focusing the keyboard input when the terminal connection is established
- Resizing based on the available space in the browser window
- Setting the TERM environment variable so common shell actions like ‘clear’ behave the way you expect
- Better support for multi-container pods
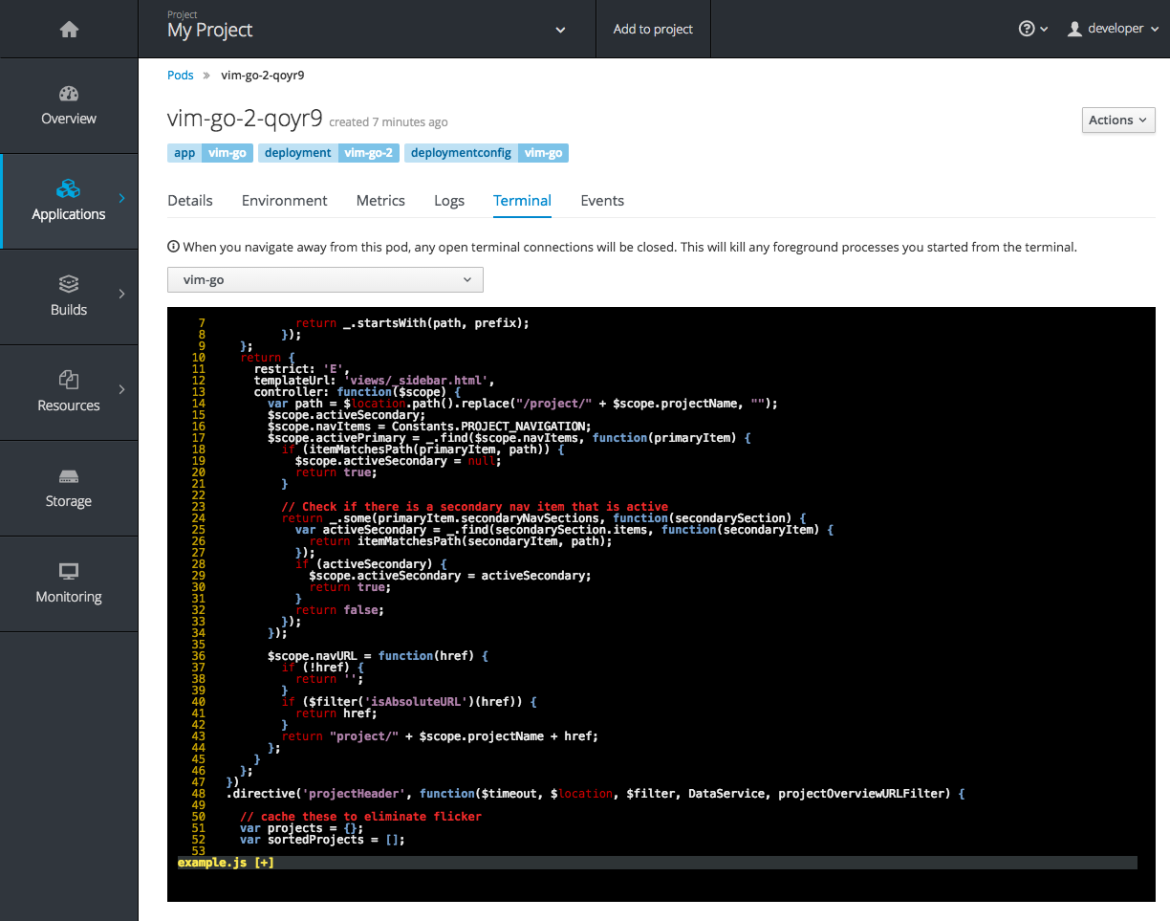
Image Details
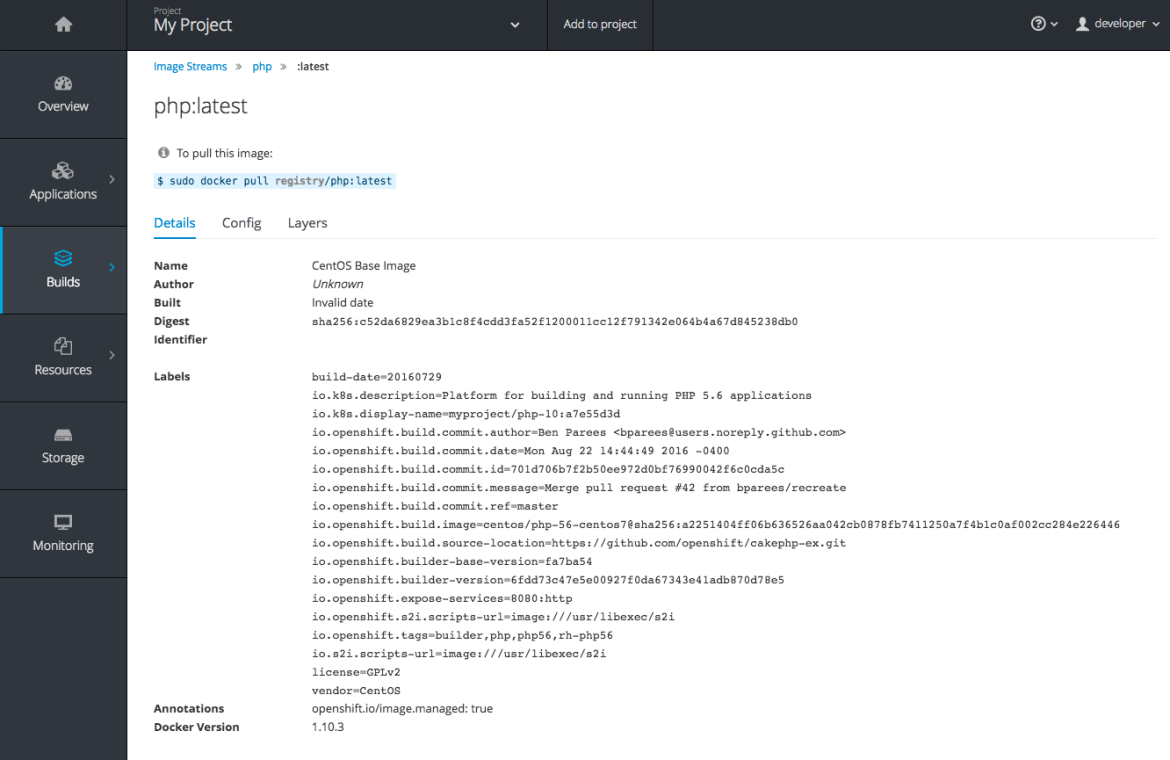
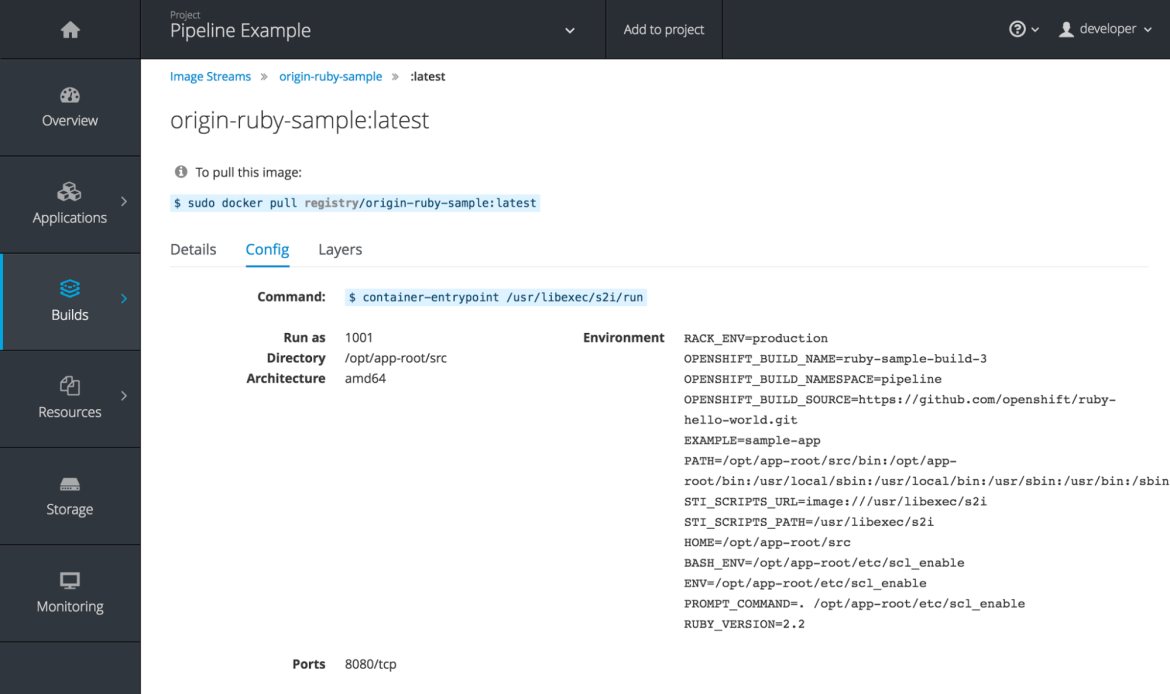
Before 3.3 there was no information in the console about the images in your image streams, aside from the SHAs. This made it difficult to know the specifics of how your image was defined unless you dropped to the CLI. Now for any image stream tag you can see the metadata, config, and layers.
Summary
You can experience the web console in all the various offerings for OpenShift 3.3. We look forward to getting your feedback on what you like, what you don't and scenarios that you'd like to have supported. Be on the look out for experience surveys and other mechanisms to help us drive the improvements.
Related Posts
If you want to learn more about the new features of OpenShift 3.3 Don't miss the following blog posts from our engineering team:
What’s New in OpenShift 3.3 – Developer Experience
