Red Hat blog
As enterprises increasingly learn about the advantages of deploying containerized applications, it is important to address a misconception that JVM does not play nicely in the cloud, especially when it comes to memory management. While it is true that many JVMs may not come out of the box perfectly configured to run in an elastic cloud environment, the variety of system properties available enables the JVM to be tuned to help get the most out of its host environment. If a containerized application is deployed using OpenShift, the application could take advantage of the Kubernetes Vertical Pod Autoscaler (VPA), which is an alpha feature. The VPA is an example of where the JVM’s default memory management settings could diminish the benefits of running applications in the cloud. This blog post will walk through the steps of configuring and testing a containerized Java application for use with the VPA, which should demonstrate the adaptability of the JVM to running in the cloud.
Vertical Scaling
Vertical scaling, the ability to grow or shrink the resources available to a particular instance of an application, is one advantage of running an application in the cloud. Containers can be given more memory or CPU resources as load increases and can be shrunk back down when idle in order to help reduce waste. When scaling a pod based on memory, the autoscaler will make recommendations based on whether a pod’s memory usage crosses a threshold. Using this feature with Java applications can be challenging, because only the total committed heap memory of the JVM--not the amount of memory used by the application--is reflected in the metrics consumed by the VPA.
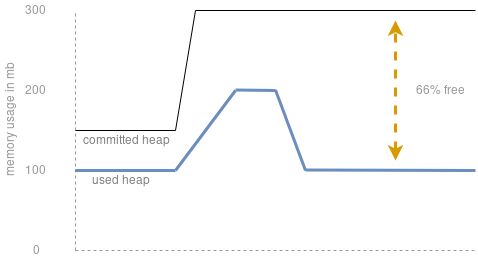
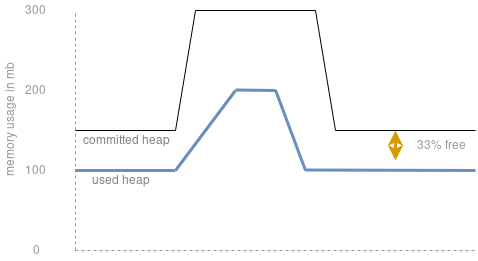
The fact that the VPA is taking into account only the total heap size can become a problem if the JVM does not release unused memory back to the host. For example, if there is a large spike in application memory usage the heap would expand to hold that memory but might not shrink afterward in order to avoid future memory allocations. This would be fine on a dedicated server because it should help maximize performance, but in a multi-tenant elastic cloud environment the resources used by one container come at the expense of resources available to another; so any memory consumption that is not being utilized effectively by the application can waste both resources and money.
MaxHeapFreeRatio
In order to help make the committed heap size more closely correspond to the application’s memory usage, you need to configure several JVM system properties, one of which is the MaxHeapFreeRatio. The MaxHeapFreeRatio indicates the maximum proportion of the heap that should be free before the JVM starts to shrink the heap generations to achieve the target.
As an example, with the default setting of MaxHeapFreeRatio=70 and a used heap size of 300MB, the total heap could be up to 1GB before the JVM would need to size down. Decreasing the the MaxHeapFreeRatio can force the JVM to more aggressively resize the heap down. By tuning the value down, the amount of memory used by the process should more closely reflect the memory used by the actual application.
Resizing Test
The MaxHeapFreeRatio sounds good in theory, but a test should help show that the JVM generally respects this configuration and should decrease the heap after a spike in usage. For this test, a few more system properties in addition to the MaxHeapFreeRatio enable the heap to shrink back down. Xms is not only the initial heap size, but also the minimal heap size, so setting that to 32m should keep the Xms from acting as a false floor, so to speak. Other settings were the GCTimeRatio=4, which allows the JVM to spend more time (up to 20%) performing garbage collection, and AdaptiveSizePolicyWeight=90, which should tell the JVM to weigh the current gc more than previous gcs when determining the new heap size. For more details on these system properties, check out the links at the end of this blog post. The Xmx max heap was set to 1.5 GB. The large heap size allows for a JVM in a test with a high throughput (or a large number of transactions per second) to have a large enough young generation to help keep objects from being promoted when the garbage collector can not sweep fast enough. The MaxHeapFreeRatio was set to 40 for the resizing test.
The tests were performed on a Wildfly 13 server application that allocated twenty random objects with an average combined size of 4MB. Load to the server was driven by Apache JMeter. The traffic pattern consisted of two peaks with an idle period in between. For the peak periods, one thread was added per second until a total of 120 was reached, at which point all threads continued for another minute. During the idle period, two threads ran for five minutes. In all cases, threads continuously made calls to the server.
To demonstrate the MaxHeapFreeRatio it is necessary to use a third metric in addition to the used heap and committed heap from the garbage collection logs. The maximum possible heap value can be calculated from the used heap. It is interesting to then see whether the committed heap falls within the expected range. For this test, the results are presented visually. With the maximum heap range represented by a bar extending from the used heap, which is depicted with orange dots. If the committed heap, represented by a blue dot, falls within this range then the JVM has been sized in accordance with the MaxHeapFreeRatio.
Here is a zoomed in view to illustrate the used heap size (orange dot), target heap range (orange error bar), and the actual heap size:
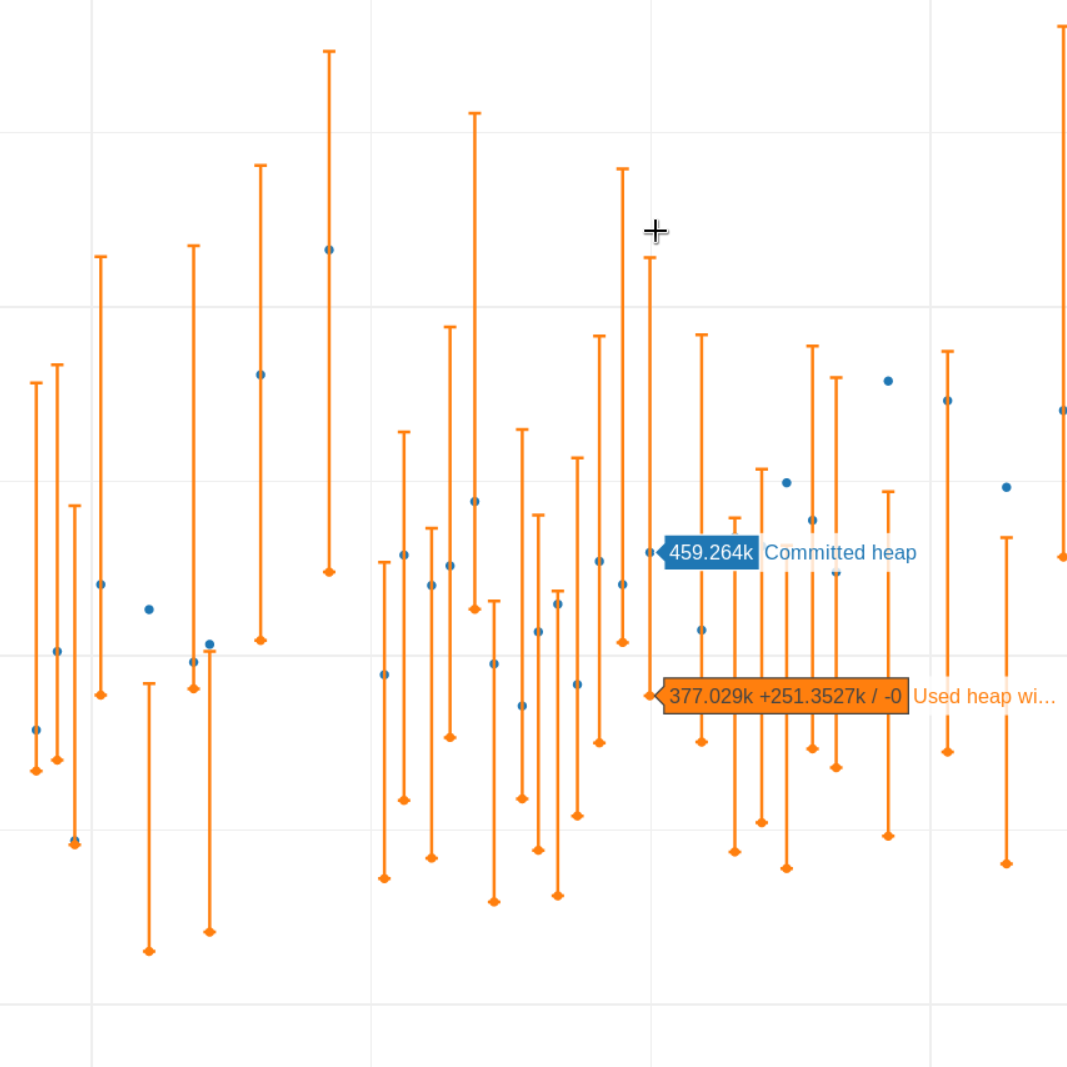
Fig 3. Detail of resizing test results graph. The highlighted sample has a used heap size of 377 MB and a committed heap size of 459MB. The maximum heap size based on a MaxHeapFreeRatio=40, indicated by the orange bar, is 628 MB.
The overall trend shows that the committed heap resizes down corresponding to the used heap:
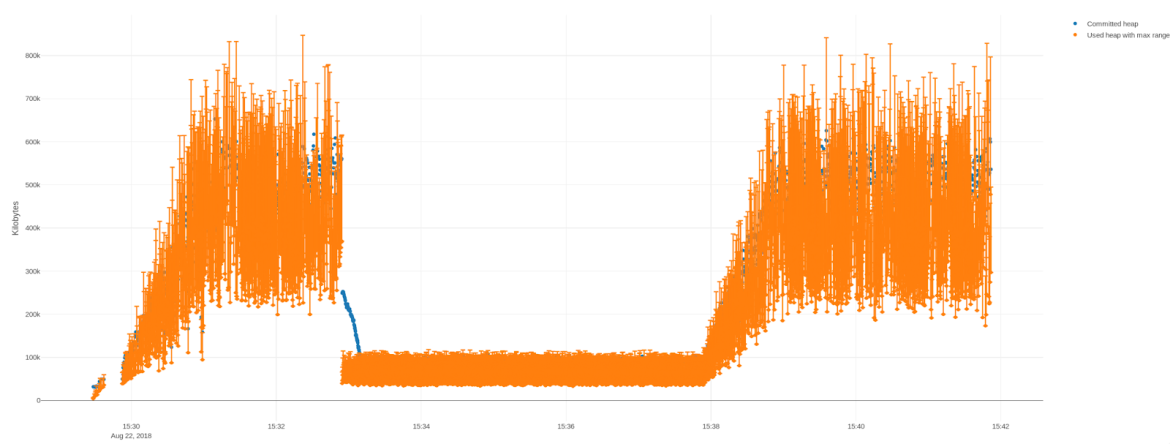
Fig 4. Results of the resizing test show that the total heap size adheres to the MaxFreeHeapRatio and tracks the application’s used heap.
The two peak periods and idle period are all visible, which demonstrates that the heap is resizing based on the actual memory usage of the application. Note that the committed heap generally follows the MaxHeapFreeRatio but not always. That is not a problem--the documentation acknowledges as much that the MaxHeapFreeRatio is a target, not a strict limit. Furthermore, it is the general behavior that will allow this system property to enable autoscaling. Without these system properties set, the committed heap (the blue markers) would not drop during the idle period. The JVM would essentially be consuming a steady amount of memory from the host, despite the drop in usage by the application inside the JVM.
Performance Tests
Now that we have seen that the MaxHeapFreeRatio can be used to force the heap to correspond to the application’s memory usage, we need to understand the effects these settings can have on the application’s performance. I created tests for both memory-intensive and cpu-intensive applications. Both tests were conducted on the same Wildfly 13 server application with the differences between the test controlled by parameters. In the memory test each request allocates on average 4MB of memory, while the CPU intensive test allocates an average of 200 KB and runs a trivial computation loop of adding and subtracting numbers which averages 100 milliseconds. Results were obtained in both tests by finding the maximum throughput before the server hit a response time greater than 2 seconds.
The tests were run with the same system properties as the previous test, except that the MaxHeapFreeRatio was declared as a variable. I also conducted a control test in which the Xmx and Xms were set equal to prevent heap resizing.
| MaxHeapFreeRatio | Trans/second | Used MB | Committed MB | Free MB | % Free | Free MB/Trans |
| 25 | 188 | 283 | 383 | 100 | 26% | .53 |
| 30 | 250 | 291 | 390 | 99 | 26% | .40 |
| 40 | 295 | 320 | 472 | 152 | 32% | .52 |
| 40 (xmx=xms) | 310 | 331 | 542 | 211 | 39% | .68 |
| 70 | 525 | 538 | 1038 | 500 | 48% | .95 |
Judging by the linear increase in transactions per second, we can see that a higher MaxHeapFreeRatio allows for greater throughput. However, that throughput comes at a price as the JVM maintains more free memory for the efficiency. The right hand column demonstrates the cost in free memory per transaction. For our sample application, the sweet spot appears to be a MaxHeapFreeRatio of 30, as that configuration manages to perform the most transactions with the least amount of wasted memory.
These costs are important to consider in an elastic cloud environment, because you could handle additional load on your application by scaling out horizontally rather than increasing your MaxHeapFreeRatio. Of course these results apply to our specific test application, but hopefully this exercise can help you tune your application for the cloud.
The results are can be more straightforward when we consider a CPU-bound application. I tested the MaxHeapFreeRatio at both 40 and 70 and saw no difference in transactions per second, which averaged around 30. The memory usage followed the trends of the previous test with 70 consuming considerably more memory than 40. If your application is computationally intensive, you may be even more inclined to consider tuning the MaxHeapFreeRatio.
Fig. 5 & Fig 6. Throughput with a MaxHeapFreeRatio of 40 and 70 respectively. The results show there is no significant difference, as both settings achieved roughly 30 transactions per second.
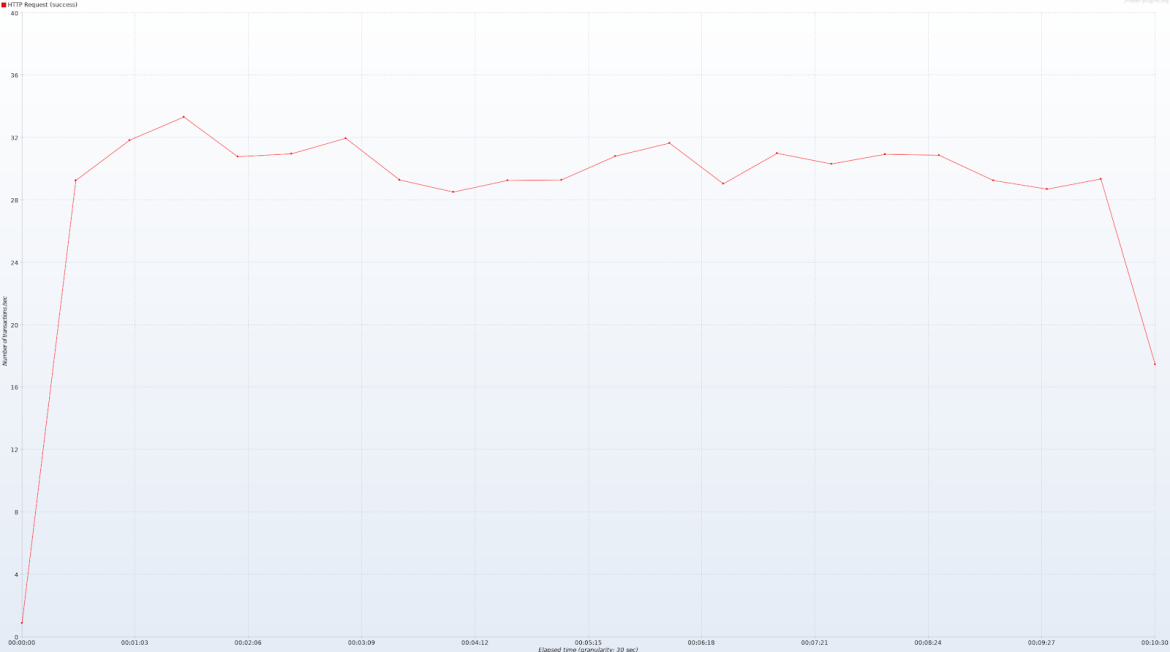
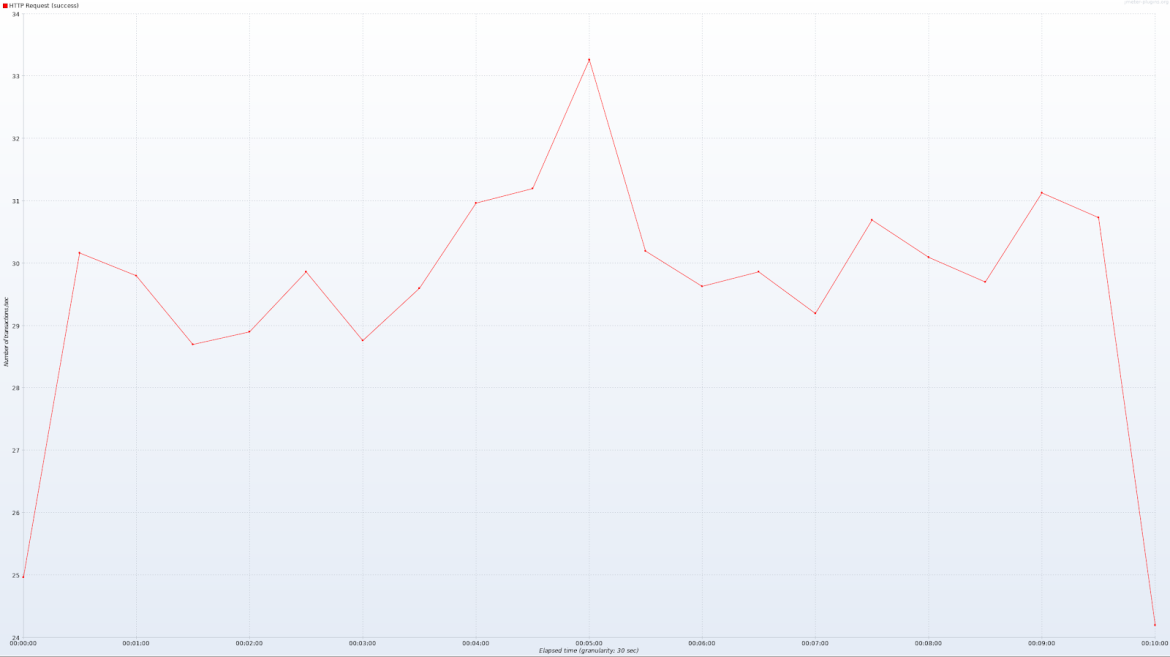
Fig. 5 & Fig 6. Throughput with a MaxHeapFreeRatio of 40 and 70 respectively. The results show there is no significant difference, as both settings achieved roughly 30 transactions per second.
Conclusion
Scaling applications to meet demand is a considerable problem for any application with some degree of fluctuating load. Autoscaling is a major benefit of deploying applications with a containerized solution such as Red Hat OpenShift. As an increasing number of enterprises see the benefits of deploying applications in this manner, it is important to know that Java applications will be able to take full advantage of features such as the Kubernetes Vertical Pod Autoscaler. Each Java release seems to have new features tailored for the cloud, but it is not necessary to upgrade or wait for new versions to begin configuring your JVM and reap the benefits of Red Hat OpenShift.
Further Reading
I highly recommend these blog posts. They were foundational for the work performed here:
OpenJDK and Containers by Christine Flood
Dude, where’s my PaaS Memory? By Andrew Dinn
Special thanks to Ravi Gudimetla and Dan McPherson for conceiving of this project and mentoring me throughout the process.

